Tableau
Tableau is a powerful and intuitive data visualization and business intelligence tool that helps individuals and organizations transform raw data into meaningful insights. By enabling interactive, drag-and-drop visualizations, Tableau empowers users to explore data, uncover trends, and make data-driven decisions quickly and effectively.
Designed for ease of use, Tableau enables non-technical users to create dashboards, charts, and analytics from various data sources without the need for extensive coding knowledge.
Key Features of Tableau
Interactive Dashboards
Tableau provides dynamic dashboards where users can interact with visualizations, apply filters, and drill down into specific data points.Variety of Visualizations
Tableau supports a wide range of chart types, including bar charts, scatter plots, line charts, maps, heat maps, and more, to suit different analytical needs.Data Connectivity
Tableau can connect to multiple data sources, such as Excel, SQL databases, cloud platforms, and APIs, enabling seamless integration and analysis.Real-Time Analytics
Tableau enables real-time data processing, allowing users to analyze live data and make timely decisions.Drag-and-Drop Functionality
Tableau’s user-friendly interface simplifies creating charts and dashboards, even for non-technical users, through intuitive drag-and-drop options.Data Blending
Combine data from different sources within Tableau to generate unified insights without complex preprocessing.Mobile Accessibility
Tableau dashboards are optimized for mobile devices, enabling users to access insights on the go.Sharing and Collaboration
Publish Tableau dashboards on Tableau Server, Tableau Online, or Tableau Public to share insights and collaborate with teams.Geospatial Analysis
Built-in mapping capabilities allow users to create geographical visualizations and analyze spatial data effectively.Extensibility with Tableau Extensions and APIs
Extend Tableau’s functionality by integrating external tools or custom scripts via APIs and extensions.
Components of Tableau
Tableau Desktop
A desktop application used to create, analyze, and share visualizations and dashboards.Tableau Server
A web-based platform for hosting and sharing dashboards securely within an organization.Tableau Online
A cloud-hosted version of Tableau Server for remote data sharing and collaboration.Tableau Public
A free version of Tableau that allows users to publish dashboards publicly online.Tableau Prep
A tool for data preparation and cleansing, allowing users to structure raw data before analysis.Tableau Mobile
A mobile application for accessing Tableau dashboards and visualizations on smartphones and tablets.
Benefits of Tableau
Ease of Use
Intuitive drag-and-drop functionality makes Tableau accessible for users of all skill levels.Improved Decision-Making
Real-time insights and advanced visualizations support better business decisions.Flexibility
Tableau integrates with a wide range of data sources and supports diverse analysis requirements.Scalability
Whether for small businesses or large enterprises, Tableau scales efficiently to meet organizational needs.Fosters Collaboration
Tableau’s sharing capabilities enhance collaboration among teams and stakeholders.Customization
Dashboards and visualizations can be customized to meet specific needs and preferences.
Applications of Tableau
Sales and Marketing
Analyze customer behavior, monitor campaign performance, and forecast sales trends.Human Resources
Track employee metrics, monitor retention and turnover rates, and improve HR strategies.Finance
Visualize budgets, track expenses, and forecast financial performance.Operations
Optimize supply chain efficiency, monitor key operational metrics, and identify bottlenecks.Healthcare
Track patient data, analyze health trends, and improve operational efficiency in medical facilities.Education
Monitor student performance, analyze enrollment trends, and manage institutional resources.
Tableau Environment
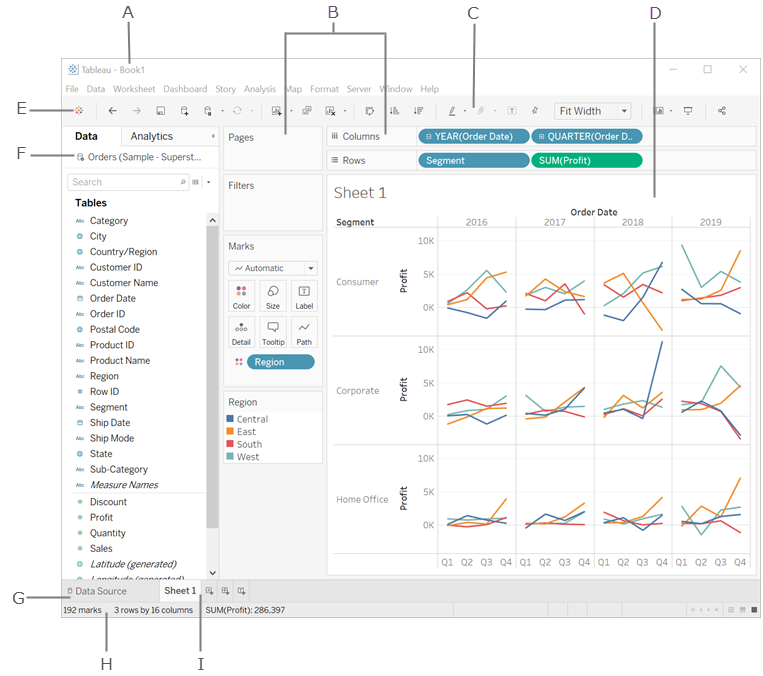
Understanding the Tableau environment is essential to effectively use its features and create insightful visualizations. Below are the key components of the Tableau interface:
A. Workbook Name
A workbook in Tableau contains sheets. A sheet can be one of the following:
- Worksheet: For creating visualizations.
- Dashboard: For combining multiple visualizations.
- Story: For narrating data insights.
For more details, refer to the Workbooks and Sheets section in Tableau’s documentation.
B. Cards and Shelves
- Drag fields from the Data pane to the cards and shelves in the workspace to add data to your visualization.
- Examples include Columns Shelf, Rows Shelf, Pages Shelf, and Filters Shelf.
C. Toolbar
- The toolbar provides quick access to commands and tools for analysis and navigation.
- Use it to create charts, adjust layouts, undo/redo actions, and more.
D. View
- The View refers to the canvas where you create visualizations, often called a “viz.”
- This is the central area where your data takes shape as graphs, charts, and other visual elements.
E. Start Page Icon
- Click the Start Page icon to connect to data sources.
- This page serves as the starting point for accessing and preparing your data for analysis.
F. Side Bar
- In a worksheet, the Side Bar contains:
-
Data Pane: Lists the fields from your data source.
- Analytics Pane: Provides tools for enhancing your visualization, such as trend lines and reference lines.
-
Data Pane: Lists the fields from your data source.
G. Data Source Page Tab
- Navigate to the Data Source Page by clicking this tab.
- Use this area to view and manage your data connections, including editing and previewing the data source.
H. Status Bar
- The Status Bar displays key information about the current view, such as the number of marks, filters applied, or performance details.
I. Sheet Tabs
-
Sheet Tabs represent the sheets in your workbook.
- These include worksheets, dashboards, and stories.
- Use these tabs to navigate between different components of your workbook.
Hands-on Exercise: Getting Started with Tableau
Install Tableau Desktop
Download and install Tableau Desktop from the official Tableau website.Connect to a Data Source
Use the “Connect” panel to link to a sample dataset (e.g., Excel file, CSV, or database).-
Create a Basic Visualization
- Drag a dimension (e.g., Product Category) to the Rows shelf.
- Drag a measure (e.g., Sales) to the Columns shelf.
- Select a chart type, such as a bar chart, to visualize the data.
- Drag a dimension (e.g., Product Category) to the Rows shelf.
-
Build Your First Dashboard
- Combine multiple sheets into a single dashboard.
- Add filters, adjust layout, and include interactivity.
- Combine multiple sheets into a single dashboard.
Publish Your Dashboard
Publish the dashboard to Tableau Public or Tableau Online to share insights with your audience.
Difference Between Tableau and Power BI
Both Tableau and Power BI are powerful tools for data visualization and business intelligence. While they serve similar purposes, they have distinct differences in terms of functionality, ease of use, pricing, and deployment. Understanding these differences can help organizations choose the right tool based on their specific needs and resources.
Feature Comparison Between Tableau and Power BI
| Aspect | Tableau | Power BI |
|---|---|---|
| Ease of Use | Offers a more advanced interface with drag-and-drop features but may have a steeper learning curve for beginners. | Intuitive and user-friendly interface suitable for both technical and non-technical users. |
| Visualization Capabilities | Advanced visualizations with high customizability, suitable for complex data exploration. | Robust visualizations with slightly fewer options for customization compared to Tableau. |
| Data Connectivity | Connects to a wide range of data sources, including cloud and on-premises databases. | Integrates well with Microsoft products and connects to various data sources, though fewer than Tableau. |
| Performance | Excels at handling large datasets with speed and efficiency. | Handles moderate to large datasets well but may lag with very large datasets compared to Tableau. |
| Integration | Integrates seamlessly with a wide range of third-party applications. | Strong integration with the Microsoft ecosystem, including Excel, Azure, and Teams. |
| Real-Time Analytics | Supports real-time data analytics with external configuration. | Built-in support for real-time data streaming. |
| Collaboration | Collaborative features are available through Tableau Server or Tableau Online. | Excellent collaboration through Power BI Service, Microsoft Teams, and SharePoint. |
| Pricing | Higher cost, suitable for large enterprises with complex analytical needs. | Affordable pricing, making it accessible to small and medium-sized businesses. |
| Deployment Options | Offers desktop, cloud, and on-premises deployment options. | Primarily cloud-based, with Power BI Desktop for local use and Power BI Report Server for on-premises. |
| AI Features | Provides advanced analytics and machine learning capabilities with Tableau Prep and extensions. | Leverages Microsoft AI for natural language queries, predictive analytics, and advanced insights. |
Key Differences
-
User Experience:
-
Tableau: Offers greater flexibility and advanced customization options but requires more technical expertise.
- Power BI: More intuitive and easier for beginners to use, especially for users familiar with Microsoft products.
-
Tableau: Offers greater flexibility and advanced customization options but requires more technical expertise.
-
Visualization:
-
Tableau: Superior visualization capabilities, with more advanced and detailed visualizations.
- Power BI: Offers visually appealing dashboards but with slightly fewer customization options.
-
Tableau: Superior visualization capabilities, with more advanced and detailed visualizations.
-
Pricing:
-
Tableau: More expensive, with separate licenses for Tableau Desktop, Server, and Online.
- Power BI: Cost-effective, with a free version (Power BI Desktop) and affordable subscription plans for Power BI Pro.
-
Tableau: More expensive, with separate licenses for Tableau Desktop, Server, and Online.
-
Performance with Large Data:
-
Tableau: Handles large datasets efficiently and is preferred for enterprise-scale analytics.
- Power BI: Performs well with moderately large datasets but may face challenges with extremely large datasets.
-
Tableau: Handles large datasets efficiently and is preferred for enterprise-scale analytics.
-
Integration:
-
Tableau: Supports a wide variety of third-party applications and databases.
- Power BI: Best for organizations already using Microsoft tools like Excel, Azure, and Teams.
-
Tableau: Supports a wide variety of third-party applications and databases.
-
AI and Advanced Analytics:
-
Tableau: Focuses on providing advanced analytics and deep insights through integrations and extensions.
- Power BI: Leverages Microsoft AI for features like Q&A (natural language processing) and predictive analytics.
-
Tableau: Focuses on providing advanced analytics and deep insights through integrations and extensions.
When to Choose Tableau
- Complex and highly customized visualizations are required.
- Large datasets need to be processed and analyzed.
- Flexibility in connecting to diverse data sources is a priority.
- The organization has skilled analysts who can use advanced features.
When to Choose Power BI
- The organization already uses Microsoft products and services.
- Cost-effective business intelligence tools are needed.
- A simpler, user-friendly tool is preferred for non-technical users.
- Real-time data streaming and easy collaboration are essential.