7  Recruitment Metrics

7.1 Overview of Recruitment Metrics

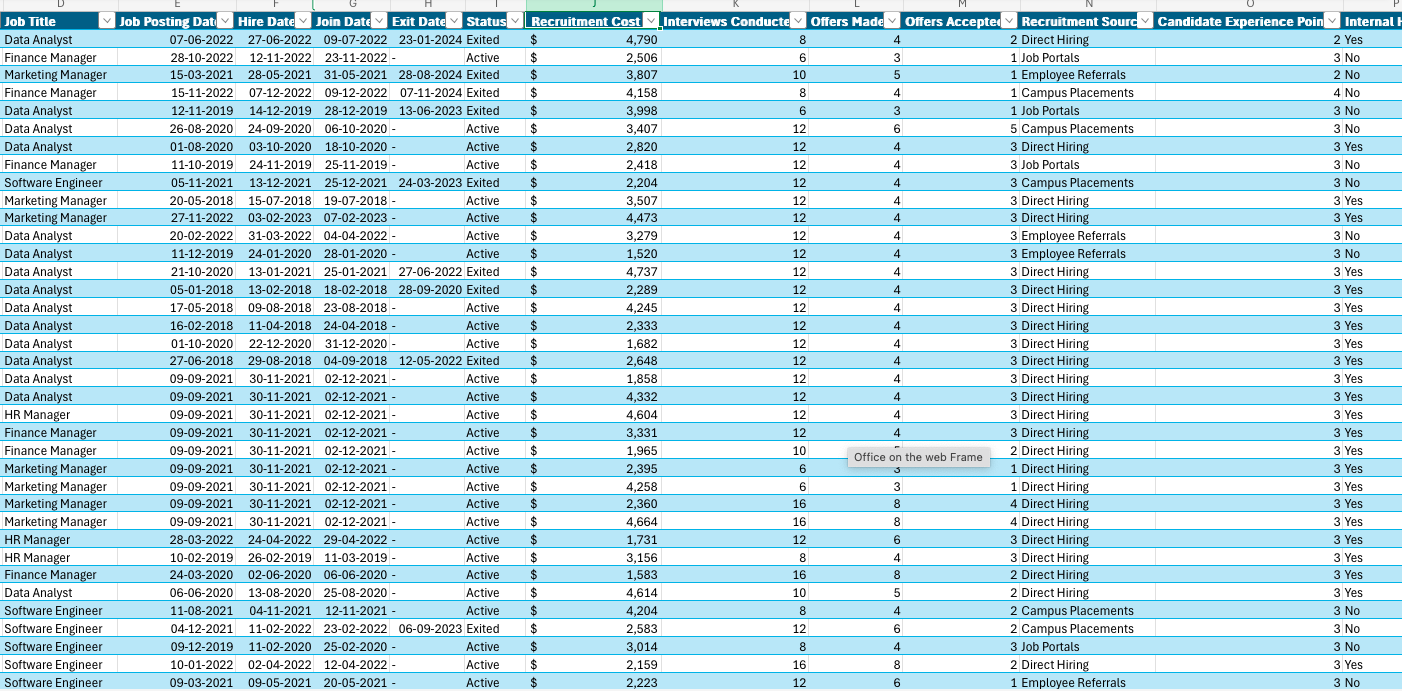
Recruitment metrics are key performance indicators (KPIs) used to assess the effectiveness and efficiency of an organization’s hiring processes. These metrics provide valuable insights into the recruitment strategy, allowing organizations to measure how well they attract, select, and retain talent. By tracking these metrics, businesses can identify areas for improvement, optimize their hiring strategies, reduce costs, and improve the quality of hires.

7.1.1 Importance of Recruitment Metrics for Organizational Success

Recruitment metrics are not only vital for evaluating the current hiring process but also for informing future recruitment strategies. By understanding key metrics, HR professionals can make data-driven decisions that lead to better hiring outcomes, higher employee retention rates, and a more engaged workforce.

  • By tracking key recruitment metrics, organizations can:

Improve Hiring Efficiency:

Recruitment metrics such as Time-to-Fill and Time-to-Onboard help identify bottlenecks in the hiring process. This allows HR teams to streamline workflows, reduce delays, and ensure quicker integration of new hires into the organization.

Enhance Candidate Quality:

Metrics like Candidate Quality and Offer Acceptance Rate help organizations assess the caliber of candidates being hired. By monitoring these metrics, companies can refine their hiring practices to attract better talent, leading to higher employee performance and retention.

Reduce Recruitment Costs:

Tracking Cost-per-Hire and Recruitment Source Effectiveness enables organizations to evaluate the ROI of different recruitment channels. By identifying the most cost-effective sources and strategies, companies can reduce unnecessary expenses while maintaining quality hires.

Boost Retention and Long-Term Success:

Metrics like New Hire Retention Rate and Average Employee Tenure provide insights into how well new hires are adjusting to the organization and how long they stay. This allows organizations to implement strategies for improving employee retention and reducing turnover costs.

Data-Driven Decision Making:

Recruitment metrics offer valuable data that informs decision-making at all levels of the hiring process. HR professionals and hiring managers can rely on these metrics to make more objective and data-driven decisions, improving the overall quality and effectiveness of hiring practices.

Align Hiring Practices with Organizational Goals:

By using recruitment metrics, organizations can ensure that their hiring strategies are aligned with broader business objectives. For example, Recruitment Funnel Metrics and Hiring Manager Satisfaction help ensure that the recruitment process supports the company’s goals for growth, culture, and diversity.

Optimize Onboarding:

Metrics like Onboarding Efficiency Rate and Time-to-Onboard measure the effectiveness of the onboarding process. By analyzing these metrics, organizations can enhance the new hire experience, ensuring that new employees feel engaged and ready to contribute faster.

Increase Accountability:

Using recruitment metrics creates transparency and accountability within the hiring process. It allows HR teams to track performance and identify areas for improvement, fostering a culture of continuous improvement.

By implementing these metrics and regularly analyzing the data, organizations can make informed decisions that optimize their recruitment processes, reduce costs, and improve both short-term and long-term business outcomes.


7.2 Key Recruitment Metrics for Workforce Optimization

7.2.1 Time-to-Fill

Definition: Time-to-Fill measures the total time taken to fill a job position, from the moment the position is posted to when the candidate accepts the offer. It reflects the efficiency of the recruitment process and how quickly the organization can meet staffing needs.

  • Variables Needed:
    • Job Posting Date
    • Hire Date
  • Formula:
Code
Excel Formula
= Hire Date - Job Posting Date

Why It’s Useful

  • Time-to-Fill provides insight into the efficiency of the hiring process. A shorter time-to-fill indicates that the company can quickly meet staffing needs, which is especially important for fast-paced industries.
  • A longer time-to-fill may highlight bottlenecks in the recruitment process or challenges in attracting the right candidates.
  • By tracking this metric, companies can identify areas for improvement in their recruitment strategies and streamline the hiring process.

7.2.2 Cost-per-Hire

Definition: Cost-per-Hire calculates the total cost of hiring a new employee, including all recruitment-related expenses (advertising, agency fees, interview costs, etc.), divided by the number of hires. This metric helps organizations understand the financial efficiency of their recruitment efforts.

  • Variables Needed:
    • Total Recruitment Costs = sum of recruitment cost
    • Number of Hires = Total number of employees
  • Formula:
Code
Excel Formula
= Total Recruitment Costs / Number of Hires

Why It’s Useful

  • Cost-per-Hire helps evaluate the financial efficiency of the recruitment process and the effectiveness of different hiring strategies.
  • Tracking this metric allows organizations to identify areas where costs can be reduced, such as choosing more cost-effective recruitment channels or reducing reliance on external agencies.
  • By analyzing this metric, organizations can balance cost with the quality of hires to ensure that recruitment efforts are both effective and affordable.

7.2.3 Offer Acceptance Rate

Definition: Offer Acceptance Rate measures the percentage of job offers accepted by candidates. A high offer acceptance rate indicates that the organization is offering competitive packages and attracting desirable talent.

  • Variables Needed:
    • Total Offers Made = sum of offers made
    • Total Offers Accepted = sum of offers accepted
  • Formula:
Code
Excel Formula
= (Total Offers Accepted / Total Offers Made) * 100

Why It’s Useful

  • This metric reflects the effectiveness of the recruitment team’s efforts in presenting compelling job offers to candidates.
  • A high acceptance rate suggests that the company is competitive in the labor market, while a low rate may indicate issues such as unattractive compensation or poor candidate experience.
  • By improving offer acceptance rates, organizations can reduce time-to-fill and the associated recruitment costs.

7.2.4 Time-to-Onboard

Definition: Time-to-Onboard measures the time between the hiring date and the employee’s first day on the job. A shorter time-to-onboard reflects an efficient onboarding process and quicker integration of new hires into the company.

  • Variables Needed:
    • Hire Date
    • Join Date
  • Formula:
Code
Excel Formula
= Join Date - Hire Date

Why It’s Useful

  • A shorter time-to-onboard ensures that new employees start their roles faster, which can improve productivity and reduce the time to reach full productivity.
  • This metric helps to streamline the onboarding process and ensures that new hires feel prepared and engaged when they start their role.
  • Improving time-to-onboard leads to faster integration, better employee experience, and quicker contribution to company goals.

7.2.5 Recruitment Source Effectiveness

Definition: Recruitment Source Effectiveness measures the effectiveness of different recruitment sources (e.g., job boards, employee referrals, agencies) in bringing in qualified candidates and filling job positions.

  • Variables Needed:
    • Recruitment source
  • Measures Needed:
    • Hires By Source
  • Formula:
Code
Excel Formula
Hires By Source = COUNTROWS(Recruitmentdata)

Why It’s Useful

  • This metric helps identify which sources are most effective in attracting quality candidates.
  • By measuring recruitment source effectiveness, organizations can allocate resources more efficiently, investing more in the best-performing channels and reducing reliance on underperforming sources.
  • It provides valuable insights into which recruitment channels generate the highest return on investment (ROI).

7.2.6 New Hire Retention Rate

Definition: New Hire Retention Rate measures the percentage of new hires who remain with the company for a specified period (e.g., 6 months or 1 year). This metric helps assess how well the company integrates new employees and how likely they are to stay long-term.

  • Variables Needed:
    • Number of New Hires Retained
    • Total Number of New Hires
  • Formula:
Code
Excel Formula
= (Number of New Hires Retained / Total Number of New Hires) * 100

Why It’s Useful

  • A high new hire retention rate suggests that the onboarding process is effective, and new hires are well-integrated into the company culture.
  • A low new hire retention rate can indicate issues with the hiring process, such as poor job fit, lack of engagement, or inadequate onboarding.
  • This metric is essential for improving employee retention strategies and ensuring that new employees feel supported and valued.

7.2.7 Interview-to-Offer Ratio

Definition: Interview-to-Offer Ratio measures the number of candidates who are invited to interviews compared to those who receive a job offer. It helps gauge the effectiveness of the interview process in selecting suitable candidates.

  • Variables Needed:
    • Number of Candidates Interviewed
    • Number of Offers Made
  • Formula:
Code
Excel Formula
= (Number of Offers Made / Number of Candidates Interviewed) * 100

Why It’s Useful

  • A higher ratio indicates that the organization is efficient in selecting candidates who are suitable for the roles and likely to accept offers.
  • A low ratio might suggest that too many unsuitable candidates are being interviewed, and the screening process needs to be more rigorous.
  • This metric is useful for refining interview practices and improving hiring decisions.

7.2.8 Candidate Experience Score

Definition: Candidate Experience Score measures how candidates perceive their experience during the recruitment process, typically gathered through surveys. A positive candidate experience can improve employer branding and attract top talent.

  • Variables Needed:
    • Survey Responses on Candidate Experience
    • Total Number of Candidates Surveyed
  • Formula:
Code
Excel Formula
= (Total Candidate Experience Points / Total Number of Candidates Surveyed) * 100

Why It’s Useful

  • A positive candidate experience can improve the company’s reputation and make it easier to attract quality candidates in the future.
  • This metric provides insight into how candidates perceive their treatment during the hiring process, from application to interview.
  • Improving candidate experience can lead to higher offer acceptance rates and better employer branding.

7.2.9 Internal Hiring Rate

Definition: Internal Hiring Rate tracks the percentage of job positions filled by internal candidates as opposed to external candidates. A high internal hiring rate indicates opportunities for career advancement within the organization.

  • Variables Needed:
    • Number of Internal Hires
    • Total Number of Hires
  • Formula:
Code
Excel Formula
= (Number of Internal Hires / Total Number of Hires) * 100

Why It’s Useful

  • A high internal hiring rate reflects an organization’s commitment to developing talent from within and providing career growth opportunities.
  • It helps to reduce recruitment costs and improves employee morale as they see clear paths for advancement.
  • This metric can also aid in succession planning and talent management strategies.

7.2.10 Recruitment Cycle Time

Definition: Recruitment Cycle Time measures the total time taken to complete the entire recruitment process, from job posting to hiring the candidate. It reflects the overall efficiency of the recruitment process.

  • Variables Needed:
    • Job Posting Date
    • Offer Acceptance Date
  • Formula:
Code
Excel Formula
= (Offer Acceptance Date - Job Posting Date)

Why It’s Useful

  • Recruitment Cycle Time helps assess how quickly the organization fills open positions, which is critical for maintaining workforce efficiency.
  • A shorter cycle time indicates a well-optimized recruitment process that minimizes delays and keeps hiring efforts on track.
  • Reducing recruitment cycle time leads to faster onboarding, improved productivity, and a quicker response to organizational needs.

These metrics are essential for tracking and improving the efficiency of your recruitment process, ensuring better alignment with organizational goals, reducing costs, and improving hiring quality. Each formula provided can be applied directly in Excel using the corresponding data from your recruitment process, helping to make data-driven decisions.

7.3 Hands-on Exercise: Recruitment metric calculation in Power BI.

Import Data

Before calculating any of the recruitment metrics in Power BI, ensure that you have imported your HR recruitment dataset (e.g., through Excel or other data sources) into Power BI. The dataset should include the following key columns:

  • Job Posting Date
  • Hire Date
  • Recruitment Cost
  • Offers Made
  • Offers Accepted
  • Employee Retention Data
  • Candidate Feedback Data
  • and any other relevant columns based on the recruitment data set.

7.3.1 Time-to-Fill

Goal: Calculate the time taken from the job posting to the candidate’s hire date.

  • Create Calculated Column: Go to the “Modeling” tab, click on “New Column,” and create a column that calculates the difference between the Hire Date and Job Posting Date columns.

DAX Formula:

Code
Time_to_Fill = DATEDIFF(Recruitmentdata[Job Posting Date], Recruitmentdata[Hire Date], DAY)
  • Metric Analysis: This will give you the average time taken to fill positions and insights into the efficiency of your recruitment process.

7.3.2 Cost-per-Hire

Goal: Calculate the cost incurred to hire a new employee, including recruitment-related expenses.

  • Create Calculated Column: If recruitment costs are broken down across different sources or components, create a column that sums up all the relevant cost data (e.g., advertising, agency fees, etc.).

DAX Formula:

Code
Cost_per_Hire = SUM(Recruitmentdata[Recruitment Cost]) / COUNTA(Recruitmentdata[Employee ID])  
  • Metric Analysis: This will give you the financial efficiency of your recruitment process, helping identify areas to optimize costs while maintaining quality hires.

7.3.3 Offer Acceptance Rate

Goal: Calculate the percentage of offers accepted by candidates.

  • Create Measure: Create a DAX measure to calculate the acceptance rate using the number of offers made and accepted.

DAX Formula:

Code
Offer_Acceptance_Rate = DIVIDE(SUM(Recruitmentdata[offers accepted]), SUM(Recruitmentdata[offers made]), 0) * 100
  • Metric Analysis: This measure will provide insights into the effectiveness of your offer strategy and the attractiveness of your compensation packages.

7.3.4 Time-to-Onboard

Goal: Calculate the time taken to onboard a new hire, from the hire date to the join date.

  • Create Calculated Column: Go to the “Modeling” tab and create a calculated column that calculates the difference between Join Date and Hire Date.

DAX Formula:

Code
Time_to_Onboard = DATEDIFF(Recruitmentdata[Hire Date], Recruitmentdata[Join Date], DAY)
  • Metric Analysis: This will help assess the efficiency of your onboarding process and how quickly new hires can contribute to the organization.

7.3.5 Recruitment Source Effectiveness

Goal: Measure the effectiveness of different recruitment sources (e.g., job boards, employee referrals, agencies) in bringing in qualified candidates.

  • Create Measure: Create a DAX measure to calculate the effectiveness of each source as a percentage of total hires.

  • Measures Required:

    • Hires_by_source

DAX Formula:

Code
Hires_by_source = COUNTROWS(Recruitmentdata)
  • Metric Analysis: This will provide insights into the recruitment channels that are performing best in terms of attracting quality candidates.

7.3.6 New Hire Retention Rate

Goal: Calculate the percentage of new hires who remain with the company after a specified period (2 years).

  • Create Measure: Create a measure for calculating new hire retention based on the number of hires retained after a certain period.

  • Columns Required:

    • Total_Tenure_days
    • New_Hire
    • New_Hire_Retained

DAX Formula:

Code
Total_Tenure_days = IF(Recruitmentdata[Status]="Exited",Recruitmentdata[Exit Date]-Recruitmentdata[Join Date],TODAY()-Recruitmentdata[Join Date])

New_Hire = IF(Recruitmentdata[Total_Tenure_days]<=730, 1,0)

New_Hire_Retained = IF(Recruitmentdata[New_Hire] = 1 && (Recruitmentdata[Status] = "Active" || Recruitmentdata[Total_Tenure_days] > 365),1,0)

New_Hire_Retention_Rate =  DIVIDE(SUM(Recruitmentdata[New_Hire_Retained]), SUM(Recruitmentdata[New_Hire]), 0) * 100
  • Metric Analysis: This will help assess the effectiveness of your onboarding process and the likelihood of new hires staying long-term.

7.3.7 Interview-to-Offer Ratio

Goal: Calculate the ratio of candidates interviewed to those who received a job offer.

  • Create Measure: Use DAX to calculate the ratio of offers made to the number of interviews.

DAX Formula:

Code
Interview_to_Offer_Ratio = DIVIDE( SUM(Recruitmentdata[offers made]), SUM(Recruitmentdata[Interviews conducted]), 0) * 100
  • Metric Analysis: This will help you evaluate how effectively your interview process selects the right candidates.

7.3.8 Candidate Experience Score

Goal: Calculate the overall candidate experience score based on survey feedback.

  • Create Measure: Calculate the experience score by averaging the responses to candidate experience questions.

DAX Formula:

Code
Candidate_Experience_Score = (DIVIDE(SUM(Recruitmentdata[Candidate Experience Points]), COUNTA(Recruitmentdata[Employee ID])*5, 0) *100)
  • Metric Analysis: This will provide insights into how candidates perceive their experience during the recruitment process, which can affect employer branding.

7.3.9 Internal Hiring Rate

Goal: Calculate the percentage of job positions filled by internal candidates.

  • Create Column: Calculate the internal hire numeric.
Code
Internal Hire Numeric = IF('Recruitmentdata'[Internal Hire] = "Yes", 1, 0)
  • Create Measure: Calculate the internal hiring rate.

DAX Formula:

Code
Internal_Hiring_Rate = DIVIDE(SUM('Recruitmentdata'[Internal Hire Numeric]), COUNT(Recruitmentdata[Employee ID]), 0) * 100 
  • Metric Analysis: This metric helps assess how much of your workforce is promoted internally and can reflect opportunities for employee development and retention.

7.3.10 Recruitment Cycle Time

Goal: Measure the total time taken to complete the entire recruitment process.

  • Create Calculated Column: Create a calculated column to compute the difference between the Offer Acceptance Date and the Job Posting Date.

DAX Formula:

Code
Recruitment_Cycle_Time = DATEDIFF(Recruitmentdata[Job Posting Date], Recruitmentdata[Hire Date], DAY) 
  • Metric Analysis: This metric will assess the overall efficiency of your recruitment process, helping to identify delays and areas for improvement.

Tips for Calculating Metrics in Power BI:

  • Data Cleansing: Make sure the dataset is clean and that there are no missing or incorrect dates for calculations like Time-to-Fill or Recruitment Cycle Time.
  • DAX Formulas: Use DAX to create calculated columns or measures to perform the necessary computations for each metric.
  • Aggregation: Utilize Power BI’s aggregation functions (SUM, AVERAGE, etc.) to calculate totals or averages across departments or positions for a broader analysis.
  • Metrics Overview: Use these calculated metrics to get a comprehensive view of your recruitment process, which can guide your strategic decisions.