8 Recruitment Dashboards
8.1 Overview of Recruitment Dashboards
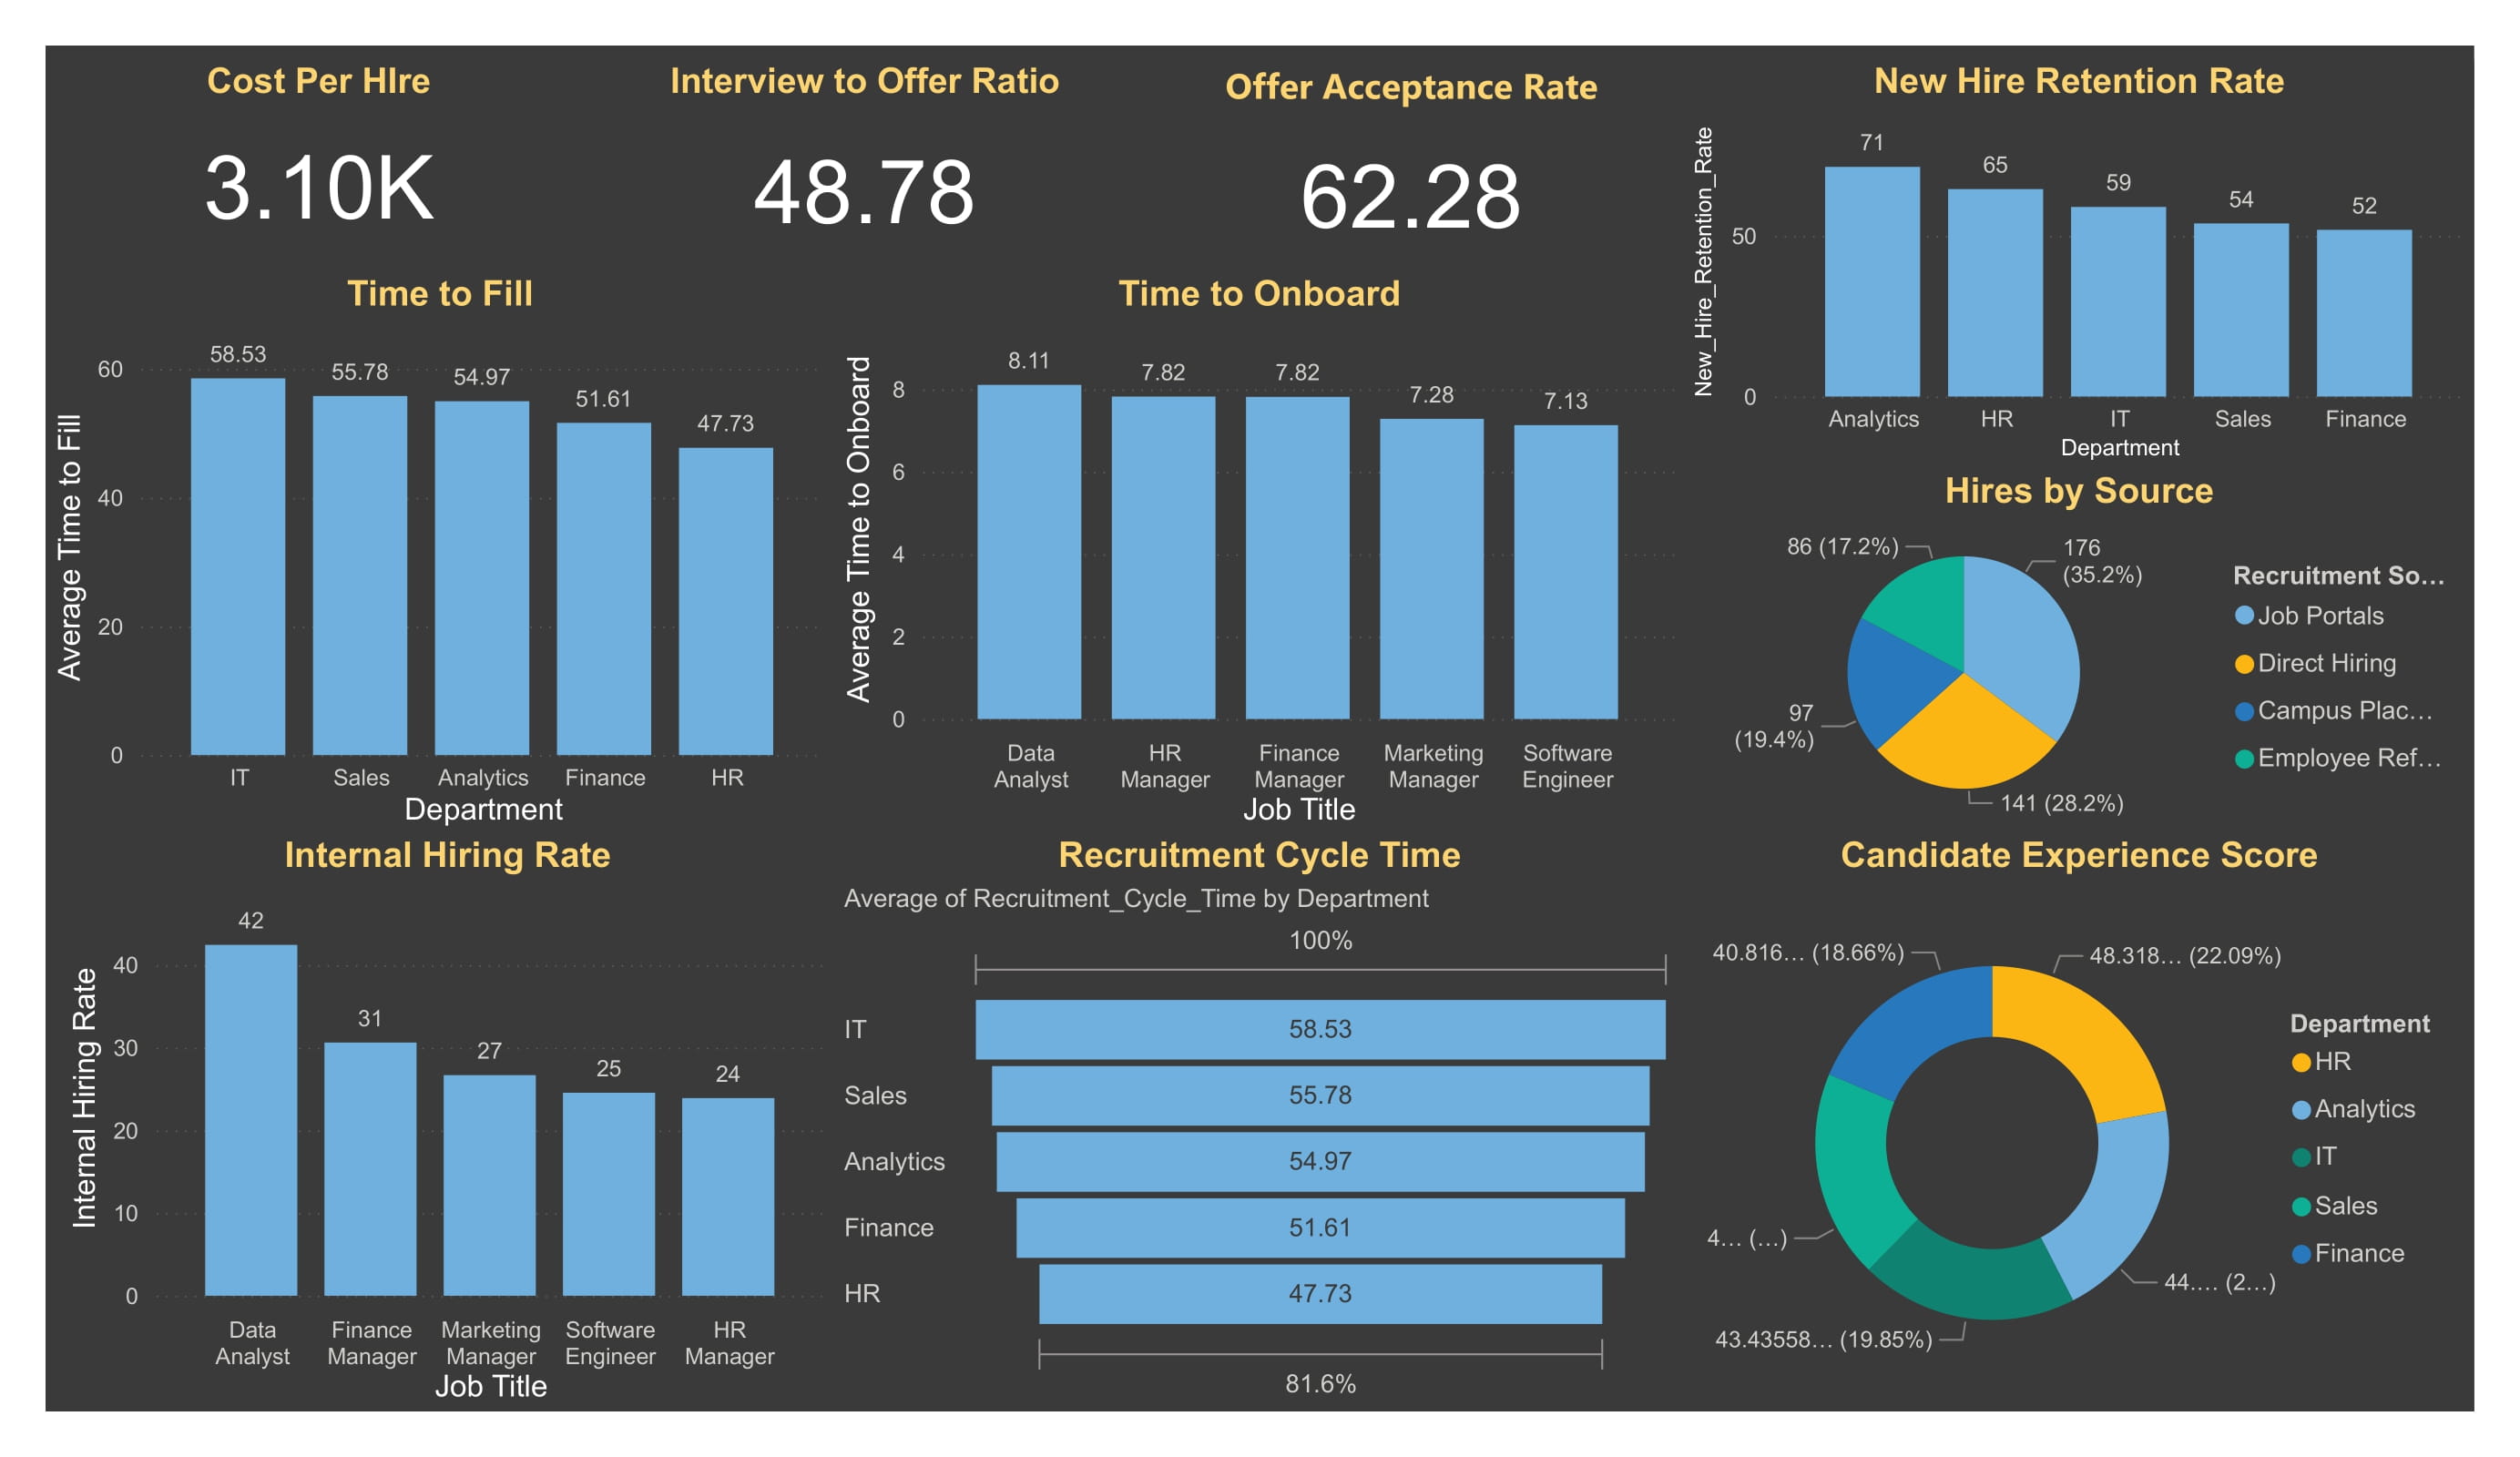
A recruitment dashboard is a vital tool for HR professionals to monitor, visualize, and analyze key recruitment metrics in an interactive and intuitive manner. These dashboards aggregate essential data points, such as Time-to-Fill, Cost-per-Hire, and Offer Acceptance Rate, to help HR teams track hiring efficiency, candidate quality, and recruitment costs. By presenting real-time data in graphical formats, recruitment dashboards enable HR managers to make data-driven decisions that improve the hiring process and optimize recruitment strategies.
In Power BI, recruitment dashboards are highly customizable, allowing users to create dynamic reports that evolve with the business’s hiring needs. Through visualization, HR professionals can quickly assess the status of recruitment efforts and identify areas for improvement.
8.2 Preliminary Steps for Visualizing Recruitment Metrics
Before you start visualizing the recruitment metrics, follow these preliminary steps to set up your dashboard in Power BI:
8.2.1 Create a New Report
- Open Power BI Desktop and click on File > New to create a new report.
- If you already have the dataset loaded, you can proceed to the next step.
8.2.2 Import Your Data
- Click on the Home tab, then click Get Data to import your recruitment data (e.g., Excel, CSV, or database).
- Once your data is loaded, review the columns and ensure the necessary data for recruitment metrics, such as
Job Posting Date,Hire Date,Number of Hires, and others, is available.
8.2.3 Create a New Page (Sheet)
- In the Fields pane, click on the New Page button (also known as a sheet or tab) to start creating your dashboard.
- You can add multiple pages to your report, each dedicated to different metrics or analysis areas, for example, one page for recruitment, another for performance, etc.
8.2.4 Add Visualizations
- To add a visualization, click on the Visualizations pane and select the type of chart or visual you want to use (e.g., bar chart, pie chart, KPI card, etc.).
- Drag and drop fields from the Fields pane into the corresponding areas of the visualization (e.g., drag
Time_to_Fillto the Values section andDepartmentto the Axis for a bar chart).
8.2.5 Customize Your Visuals
- Once the visualizations are added, customize them by adjusting colors, labels, and titles. This can be done in the Format pane, where you can change the appearance of your visuals.
- You can also add Slicers and Filters for interactivity, which will allow users to interact with the data (e.g., filter by department, job title, etc.).
8.2.6 Arrange Visualizations on the Dashboard
- After creating your visuals, drag and position them on the page. Arrange them logically, prioritizing key metrics such as
Time-to-FillandCost-per-Hireto ensure they are easily visible. - Use a tile layout for a clean, organized dashboard, or a floating layout to layer your visuals.
8.3 Visualizing Recruitment Metrics in Power BI
Now that the preliminary setup is done, let’s visualize the recruitment metrics.
Time-to-Fill
Visualization: Bar Chart or Column Chart
-
How to Visualize:
- Drag the
Departmentfield to the Axis andTime_to_Fillto the Values section. - Use a bar chart or column chart to display the average time taken to fill positions for each department.
- Add a slicer for the
Date of Hireto allow users to filter data by time periods (e.g., by month or quarter).
- Drag the
- Goal: This visualization will provide insights into recruitment efficiency, showing how long it takes to fill positions across different departments.
Cost-per-Hire
Visualization: KPI Card or Gauge Chart
-
How to Visualize:
- Use a KPI card to display the overall
Cost_per_Hire. - For more visual impact, use a gauge chart to show the metric against a target value, indicating whether recruitment costs are within the desired range.
- Use a KPI card to display the overall
- Goal: The KPI card or gauge will provide an at-a-glance view of how much is being spent on recruitment efforts per new hire.
Offer Acceptance Rate
Visualization: Pie Chart or Donut Chart
-
How to Visualize:
- Use a pie chart or donut chart to show the proportion of accepted versus rejected job offers.
- Drag
Offers AcceptedandOffers Madeto the Values and Legend sections respectively. - This will help HR teams assess the effectiveness of their offers in attracting candidates.
- Goal: The chart will highlight how attractive the company’s offers are and how well the recruitment team is performing in closing candidates.
Time-to-Onboard
Visualization: Line Chart or Bar Chart
-
How to Visualize:
- Use a line chart to visualize
Time_to_Onboardacross departments or time periods. - Drag
DepartmentorMonthto the Axis andTime_to_Onboardto the Values. - This will show how long it takes to onboard employees in different departments or over different periods.
- Use a line chart to visualize
- Goal: This metric visualization will help assess the efficiency of the onboarding process and highlight areas where onboarding can be streamlined.
Recruitment Source Effectiveness
Visualization: Stacked Bar Chart
-
How to Visualize:
- Create a stacked bar chart to show the number of hires sourced from each recruitment channel.
- Drag
Sourceto the Axis andNumber of Hires from Sourceto the Values. - This will give insight into which recruitment sources (job boards, referrals, agencies) are most effective.
- Goal: This visualization helps HR teams identify the best-performing recruitment channels, so they can allocate resources accordingly.
New Hire Retention Rate
Visualization: Line Chart or Bar Chart
-
How to Visualize:
- Use a line chart or bar chart to visualize the retention rate for new hires.
- Drag
Month of Hireto the Axis andNew_Hire_Retention_Rateto the Values. - This will show how well new hires are sticking with the company over time.
- Goal: This chart helps measure how effectively the company retains new hires over a specified period.
Interview-to-Offer Ratio
Visualization: Column Chart
-
How to Visualize:
- Create a column chart with
Interview-to-Offer Ratioas the value andDepartmentorRoleas the axis. - This will help visualize how many interviews it takes to make a job offer in different departments.
- Create a column chart with
- Goal: This metric visualization helps assess the efficiency of the interview process, evaluating how well candidates are selected during interviews.
Candidate Experience Score
Visualization: Bar Chart
-
How to Visualize:
- Create a bar chart with
Candidate Experience Scoreas the value andDepartmentas the axis. - This will help HR teams visualize how candidates rate their experience in the recruitment process.
- Create a bar chart with
- Goal: This visualization helps identify areas where the recruitment process can be improved, based on candidate feedback.
Internal Hiring Rate
Visualization: Pie Chart or Donut Chart
-
How to Visualize:
- Use a pie chart to display the percentage of internal hires compared to external hires.
- Drag
Internal HiresandExternal Hiresto the Values and Legend sections.
- Goal: This metric visualization helps assess how much of the workforce is promoted internally and can reflect opportunities for employee development and retention.
Recruitment Cycle Time
Visualization: Line Chart
-
How to Visualize:
- Use a line chart to show the recruitment cycle time across different time periods (e.g., month, quarter).
- Drag
Monthto the Axis andRecruitment_Cycle_Timeto the Values.
- Goal: This visualization will help track the overall efficiency of the recruitment process over time.
8.4 Interactive Dashboards: Enhancing User Experience in Power BI
Interactive dashboards provide users with the flexibility to explore the data in more depth. Power BI allows HR professionals to add several interactive features, such as filters, slicers, drill-through actions, and dynamic visuals, that make dashboards more engaging and informative.
8.4.1 Power BI Functions for Interactivity
-
Slicers:
- Slicers enable users to filter the data dynamically. For example, adding a slicer for
Department,Job Title, orTime Periodlets users focus on specific segments of the recruitment data. -
How to Add: Drag the
Departmentfield into the slicer visual and select the slicer type (dropdown or list).
- Slicers enable users to filter the data dynamically. For example, adding a slicer for
-
Filters:
- Filters allow users to view only relevant data in each visualization. For instance, you can apply filters to display only candidates from a specific department or those who accepted an offer within a certain period.
- How to Add: Use the Visual Level Filters, Page Level Filters, or Report Level Filters to apply filters across the dashboard.
-
Drill-Through:
- Drill-through enables users to right-click on a data point in a chart and view more detailed data in a new report page.
- How to Add: Right-click on a chart element (e.g., a department’s turnover rate) and select Drillthrough to see more detailed metrics related to that element.
-
Dynamic Titles:
- Power BI allows you to create dynamic titles that change based on user interactions. For example, the title of the
Time-to-Fillchart can dynamically update to reflect the selected department or time period. -
How to Add: Use the Text Box visual and bind it to a field (e.g.,
Department) to make the title dynamic.
- Power BI allows you to create dynamic titles that change based on user interactions. For example, the title of the
-
Tooltips:
- Tooltips provide additional context when users hover over data points in a visualization.
-
How to Add: Add additional fields (e.g.,
Candidate Feedback,Interview Duration) to the Tooltip field well to provide supplementary information.
8.5 Hands-on Exercise: Designing Recruitment Dashboards in Power BI
In this exercise, you will create an interactive recruitment dashboard in Power BI by visualizing key metrics such as Time-to-Fill, Cost-per-Hire, and Offer Acceptance Rate.
-
Prepare Your Data:
- Import the recruitment dataset into Power BI, ensuring it includes key fields such as
Job Posting Date,Hire Date,Offers Made,Number of Hires, etc.
- Import the recruitment dataset into Power BI, ensuring it includes key fields such as
-
Create Basic Visualizations:
- Create bar charts, pie charts, and KPI cards to visualize key metrics like
Time-to-Fill,Cost-per-Hire, andOffer Acceptance Rate.
- Create bar charts, pie charts, and KPI cards to visualize key metrics like
-
Add Interactive Features:
- Add slicers for
Department,Time Period, andJob Titleto allow users to interact with the dashboard. - Enable drill-through actions to provide more detailed views of specific recruitment metrics.
- Add slicers for
-
Design the Dashboard:
- Organize the visuals logically and ensure that key metrics are easily accessible. Customize the color scheme and layout for better clarity and aesthetics.
-
Publish and Share:
- Once the dashboard is complete, publish it to Power BI Service and share it with HR stakeholders for real-time monitoring of recruitment performance.
By completing this exercise, you will gain hands-on experience in creating a recruitment dashboard that empowers HR professionals to track, analyze, and optimize the recruitment process effectively.
8.6 Assignment 3: Visualizing Recruitment Metrics in Power BI
8.6.1 DATA file Link for
Recruitment Metrics
8.6.2 Objective
To use Power BI to create meaningful visualizations of recruitment metrics, enabling data-driven insights into the efficiency and effectiveness of recruitment processes.
8.6.3 Instructions
-
Dataset Preparation:
- Ensure your dataset includes the necessary columns:
- Department, Job Title, Time_to_Fill, Cost_per_Hire, Offers Made, Offers Accepted, Time_to_Onboard, Recruitment Source, New Hire Retention Rate, Interview-to-Offer Ratio, Candidate Experience Score, Internal Hiring Rate, Recruitment Cycle Time.
- Ensure your dataset includes the necessary columns:
-
Metrics Calculation:
- Confirm calculated fields such as:
-
Time_to_Fill,Cost_per_Hire,Time_to_Onboard,Recruitment Source Effectiveness, and others as required.
-
- Confirm calculated fields such as:
-
Visualizations:
- Create the following visualizations in Power BI based on the dataset.
8.6.4 Tasks and Visualizations
1. Time-to-Fill
- Visualization: Bar Chart or Column Chart
-
Steps:
- Drag
Departmentto the Axis andTime_to_Fillto the Values. - Add a slicer for
Date of Hireto filter by time periods.
- Drag
- Goal: Analyze average time-to-fill positions across departments.
2. Cost-per-Hire
- Visualization: KPI Card or Gauge Chart
-
Steps:
- Add a KPI card to display
Cost_per_Hire. - Optionally, use a gauge chart to compare the metric against a target value.
- Add a KPI card to display
- Goal: Gain insights into recruitment costs.
3. Offer Acceptance Rate
- Visualization: Pie Chart or Donut Chart
-
Steps:
- Drag
Offers MadeandOffers Acceptedto Values and Legend. - Display the proportion of accepted offers.
- Drag
- Goal: Evaluate offer competitiveness and candidate attraction.
4. Time-to-Onboard
- Visualization: Line Chart or Bar Chart
-
Steps:
- Drag
DepartmentorMonthto the Axis,Time_to_Onboardto Values. - Show onboarding times across departments or time periods.
- Drag
- Goal: Identify onboarding process efficiency.
5. Recruitment Source Effectiveness
- Visualization: Stacked Bar Chart
-
Steps:
- Use
Recruitment Sourceas the Axis andNumber of Hiresas Values. - Compare effectiveness across recruitment channels.
- Use
- Goal: Identify best-performing recruitment sources.
6. New Hire Retention Rate
- Visualization: Line Chart or Bar Chart
-
Steps:
- Plot
Month of Hireon the Axis andNew Hire Retention Rateon Values. - Show retention rates over time.
- Plot
- Goal: Assess new hire retention success.
7. Interview-to-Offer Ratio
- Visualization: Column Chart
-
Steps:
- Use
DepartmentorRoleon the Axis andInterview-to-Offer Ratioon Values. - Compare efficiency of interviews across departments.
- Use
- Goal: Refine interview processes.
8. Candidate Experience Score
- Visualization: Bar Chart
-
Steps:
- Use
Departmenton the AxisandCandidate Experience Score` on Values**. - Evaluate candidate perceptions of the recruitment process.
- Use
- Goal: Improve candidate experiences.
9. Internal Hiring Rate
- Visualization: Pie Chart or Donut Chart
-
Steps:
- Display the percentage of internal hires versus external hires.
- Goal: Assess internal promotion opportunities.
10. Recruitment Cycle Time
- Visualization: Line Chart
-
Steps:
- Plot
Monthon the Axis andRecruitment Cycle Timeon Values. - Track recruitment efficiency over time.
- Plot
- Goal: Optimize the recruitment timeline.
8.6.5 Submission Instructions
- Save your Power BI file as
RollNo_RecruitmentMetrics.pbix. - Submit:
- Power BI File: Containing calculated fields and visualizations.
-
Insights Document: A Word or PDF document summarizing:
- Key insights derived from visualizations.
- Challenges faced during the exercise.
8.6.6 Notes
- Ensure all visuals have proper titles, legends, and labels.
- Use slicers for interactivity where applicable.
- Focus on clear and professional presentation.
8.6.7 Output file for Assignment 3:
Recruitment Dashboard in PowerBI