Code
= (Number of Goals Achieved / Total Number of Goals Set) * 100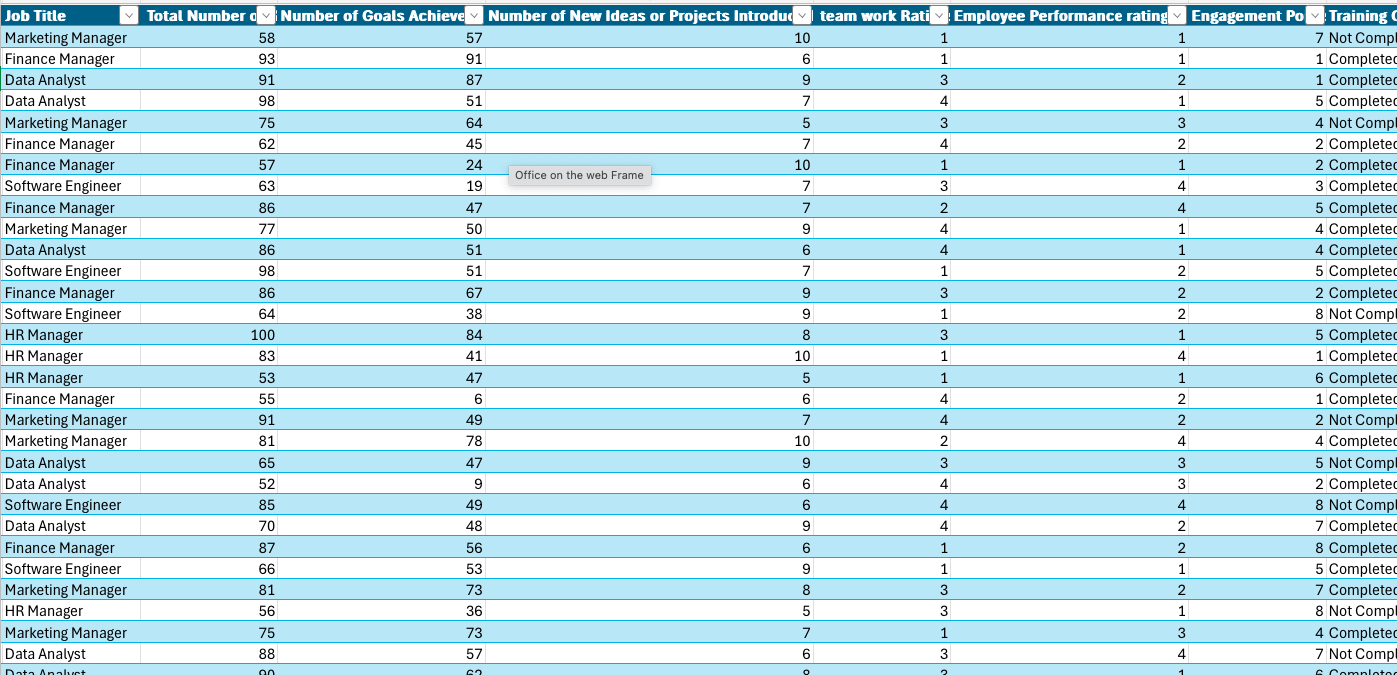
Employee performance metrics are key performance indicators (KPIs) used to assess and track the efficiency, effectiveness, and contributions of employees within an organization. These metrics help managers and HR professionals understand how well employees are performing, identify areas for improvement, and align individual performance with the organization’s strategic goals. By consistently measuring and analyzing employee performance, businesses can ensure better productivity, engagement, and overall organizational success.
Employee performance metrics are crucial for both managing day-to-day operations and driving long-term growth. They provide objective data that HR teams and managers can use to make informed decisions about employee development, compensation, and overall workforce management. With accurate performance data, organizations can maximize their human capital, improve employee satisfaction, and achieve business objectives.
Metrics like Output per Employee and Goal Achievement Rate help identify high-performing employees and areas where productivity can be improved. Regular tracking of these metrics enables managers to recognize and reward top performers while addressing underperformance.
By monitoring metrics such as Skills Development Progress and Training Completion Rate, HR teams can identify skills gaps and tailor development programs to improve employee competencies. This ensures that employees are continuously growing in line with the company’s needs.
Performance metrics like Employee Satisfaction and Employee Retention Rate provide insights into how engaged employees are within the organization. High levels of engagement are often linked to improved job performance, creativity, and long-term employee loyalty.
Clear and quantifiable metrics help standardize performance reviews, providing a fair and objective basis for evaluating employee performance. This can lead to more effective feedback conversations and help employees set actionable goals for improvement.
Performance metrics ensure that employees’ daily activities and overall performance align with the organization’s broader strategic objectives. For instance, Team Collaboration Score and Individual Performance Against KPIs ensure that employees contribute meaningfully to key projects and business goals.
Metrics such as Exit Interview Analysis and Turnover Rate help identify the reasons behind employee exits, allowing organizations to implement targeted strategies to improve retention. High turnover can be a sign of underlying issues, and by measuring this metric, organizations can take proactive measures to reduce churn.
Regular performance measurement and feedback promote a culture of excellence. When performance is tracked and shared transparently, employees are more likely to take ownership of their contributions, knowing that their efforts are being recognized and rewarded.
By aligning performance metrics with compensation, organizations can ensure that high performers are rewarded appropriately. Performance-Based Bonuses and Merit Pay programs can be linked directly to employee achievements, helping to retain top talent.
Using performance metrics fosters accountability throughout the organization. Employees are aware that their progress is being measured, and managers are able to hold individuals and teams accountable for meeting expectations.
In addition to individual performance, tracking team-based metrics like Team Goal Completion Rate and Collaboration Efficiency helps managers assess how well teams are working together toward common objectives.
Employee performance metrics are essential for organizations looking to optimize productivity, employee satisfaction, and long-term business success. By aligning individual and team performance with organizational goals, businesses can foster a high-performance culture, improve retention, and enhance overall efficiency. Regular analysis of these metrics ensures that the workforce remains engaged, skilled, and aligned with the organization’s strategic direction.
Employee performance metrics are key indicators that help assess, track, and improve an employee’s contributions within an organization. These metrics enable HR teams and managers to evaluate productivity, growth, engagement, and overall employee performance. Below are 10 important performance metrics for evaluating employee performance and enhancing organizational effectiveness.
Definition: Goal Achievement Rate measures the percentage of goals that an employee or team successfully meets within a specific time period. It helps assess how effectively employees align their efforts with organizational objectives.
= (Number of Goals Achieved / Total Number of Goals Set) * 100Definition: Output per Employee measures the productivity of an employee by calculating the total output (e.g., units produced, tasks completed) divided by the number of employees. It provides insights into employee efficiency.
= Total Output / Number of EmployeesDefinition: Innovation Rate measures the frequency and quality of new ideas, processes, or products introduced by employees. It reflects how well employees contribute to the organization’s innovation and creativity.
= (Number of New Ideas or Projects Introduced / Total Number of Employees) * 100Definition: Performance Review Score is an evaluation of an employee’s work performance based on predetermined metrics or feedback, typically conducted annually or semi-annually.
= (Sum of Employee Ratings / Total Number of Employees Reviewed)Definition: Employee Engagement Score measures the emotional commitment and enthusiasm employees have towards their work and the organization. High engagement levels are correlated with increased productivity and retention.
= (Total Engagement Points / Total Number of Surveyed Employees) * 100Definition: Training Completion Rate measures the percentage of employees who successfully complete a training program, indicating the effectiveness of employee development initiatives.
= (Number of Employees Who Completed Training / Total Number of Employees Assigned Training) * 100Definition: Customer Satisfaction measures the level of satisfaction customers have with the products or services provided by the company. It is typically gathered through customer feedback surveys or direct responses.
= (Total Satisfaction Points / Total Number of Surveyed Customers) * 100Definition: Task Efficiency measures the ability of an employee to complete tasks within a given time frame without compromising the quality of the work. It indicates how effectively employees are using their time.
= Total Tasks Completed / Total Time Spent on TasksDefinition: Time to Competency measures the time it takes for a new hire to reach full productivity in their role. It helps assess the effectiveness of the onboarding and training processes.
= Date Employee Reached Full Competency - Join DateDefinition: Quality of Work measures the accuracy, thoroughness, and overall quality of an employee’s output. It evaluates how well an employee meets or exceeds the standards set for their role.
= (Total Tasks Completed without Errors / Total Tasks Completed) * 100Before calculating any of the employee performance metrics in Power BI, ensure that you have imported your HR performance dataset (e.g., through Excel or other data sources) into Power BI. The dataset should include the following key columns:
Goal: Calculate the percentage of goals that an employee or team successfully meets within a specific time period.
Number of Goals Achieved and Total Number of Goals Set.DAX Formula:
Goal_Achievement_Rate = ('Performancedata'[Number of Goals Achieved] / 'Performancedata'[ Total Number of Goals Set]) * 100 Goal: Calculate the total output (e.g., units produced, tasks completed) per employee to measure productivity.
DAX Formula:
Output_per_Employee = sum('Performancedata'[Number of Goals Achieved])/ counta('Performancedata'[Employee ID])Goal: Measure the frequency and quality of new ideas, processes, or products introduced by employees.
DAX Formula:
Innovation_Rate = (sum('Performancedata'[Number of New Ideas or Projects Introduced])/ counta('Performancedata'[Employee ID]) * 100)Goal: Calculate the average performance score across all employees.
DAX Formula:
Performance_Review_Score = AVERAGE('Performancedata'[Employee Performance Ratings]) Goal: Calculate the overall employee engagement score based on survey responses.
DAX Formula:
Employee_Engagement_Score = sum('Performancedata'[Engagement Points])/COUNTA('Performancedata'[Employee ID]) * 100Goal: Calculate the percentage of employees who completed a training program.
Training_Completion_Status_Numeric = IF('Performancedata'[Training Completion Status] = "Completed", 1, 0)DAX Formula:
Training_Completion_Rate = sum(Performancedata[Training_Completion_Status_Numeric])/COUNTA(Performancedata[Employee ID])*100Goal: Calculate the customer satisfaction score, reflecting the quality of service provided by employees, gathered from customer feedback surveys.
DAX Formula:
Customer_Satisfaction = AVERAGE('Performancedata'[Satisfaction Points]) * 100Goal: Calculate the ability of an employee to complete tasks within a given time frame without compromising the quality of the work.
DAX Formula:
Task_Efficiency = 'Performancedata'[Number of Goals Achieved] / 'Performancedata'[Time spent on tasks]Goal: Measure the time it takes for new hires to reach full competency in their roles.
DAX Formula:
Time_to_Competency = DATEDIFF('Performancedata'[Join Date], 'Performancedata'[Date Employee Reached Full Competency], DAY)Goal: Calculate the percentage of tasks completed without errors to assess the quality of an employee’s work.
DAX Formula:
Quality_of_Work = ( 'Performancedata'[Tasks completed without errors] / 'Performancedata'[Number of Goals Achieved] ) * 100SUM, AVERAGE, or COUNT to evaluate these metrics across different teams or time periods.